Demolition Neighbor Notification
Parcel-level buffer analysis for a 30-site demolition project · Aftermath Disaster Recovery · St. Louis, MO
Part 1 · The Engagement
The Client
Aftermath Disaster Recovery is a disaster recovery and demolition contractor working in St. Louis. A returning client, they brought 30 new demolition sites across north St. Louis and needed a neighbor notification plan for each one, starting with a same-day turnaround on the first site.
The Problem
Before a structure comes down, the occupants of every building near the site need notice. For this project the rule was every occupied structure within 500 feet of each demolition parcel.
The manual approach fails in three ways at once. Looking up parcels one at a time on the assessor's website means thousands of lookups across 30 demolition sites, and days of clerical work per round. Judging distance by eye is its own problem, because a parcel counts if any part of it touches the 500 foot zone, and at the margins there is no way to tell from an aerial view whether a lot 480 or 520 feet out qualifies. And vacancy is a guess, because nothing on a map says whether a lot holds an occupied two-family flat or an empty foundation. Each failure has a real cost. A missed notification creates liability, and a hanger on a vacant lot wastes crew time.
| Task | By hand | With this analysis |
|---|---|---|
| Finding neighboring parcels | One-at-a-time lookups on the assessor's site, days per round | All 126,958 city parcels searched in about a minute |
| Applying the 500 foot rule | Distance estimated by eye from an aerial view | Measured boundary to boundary in a projected coordinate system |
| Handling vacant lots | Guessed from the map | Filtered on assessor records, with 134 conflicting parcels flagged for field review |
| Ordering door hangers | A single count that ignores addresses near several sites | Two totals covering either demolition schedule, plus grouping for mixed schedules |
The Approach
The analysis was built around decisions the client could stand behind, each confirmed rather than assumed.
The 500 feet measures from the parcel boundary. The buffer extends from the edge of the demolition parcel, not from its center, a rule confirmed with the client before the first list was delivered. A center-measured buffer would quietly shrink coverage around large lots, which is exactly where a missed notification would be hardest to defend.
Parcels with contradictory records are flagged for review in the field. A parcel is excluded from the notification list when the assessor's records show no buildings on it. But assessor data lags reality, and some records contradict themselves. A lot can have no buildings on file while its vacancy flag reads N or its improvement value is greater than zero. Those parcels go onto a field review list that names the exact conflict for each one. The program produced 134 of them, and field crews resolve each at the door rather than the office resolving them by assumption.
Both print totals are reported, because the correct one depends on the demolition schedule. Every address gets a suggested hanger count from the assessor's dwelling unit count, never less than one. If all 30 sites are noticed together, 2,598 hangers cover every address once. If sites are demolished on separate schedules, each event triggers its own notification, and an address near three sites needs three hangers, for a total of 3,948. When only some sites share a schedule, they can be grouped, so overlaps within a group count once and overlaps across groups count separately. The tool recomputes the total for any declared grouping, so the client can ask what the count becomes if sites 1 and 13 go together and get the answer from a rerun. The schedule is the client's decision, so the analysis reports both totals and the client orders the quantity that matches the demolition calendar, with the overlap already counted.
Checklists are ordered the way crews walk. Each site gets a printable checklist sorted nearest street first, then house number within each street, so a crew works one street at a time instead of following a spreadsheet sorted alphabetically. The method is documented in the deliverables as a heuristic rather than an optimized route.
Every assumption is written down. Each run ships with an assumptions log stating the buffer rule, the structure filter, the hanger policy, and every other judgment call in plain language. When the client forwards a list to a city inspector or a subcontractor, the methodology travels with it.
The Deliverables
The client received seven files covering all angles:
doorhanger_list.csv· The master list of 1,636 unique addresses, one row each, sorted street by street. Each row carries the address and ZIP, building and dwelling unit counts, the land use code with the city's official description, the vacancy and improvement fields, the suggested hanger count, every demolition site the address is near, and the number of separate notifications it would need.doorhanger_list.xlsx· One workbook holding four sheets:- the master list above, formatted for review
- the same addresses reorganized by demolition site instead of deduplicated, so an address near several sites appears once under each, with its exact distance in feet to that site
- the field review list
- every excluded parcel with the reason it was left off, with the field review parcels flagged among them as a subset, so nothing is dropped silently and any exclusion can be defended
field_review_list.csv· The 134 flagged parcels as a standalone file, each naming the specific conflicting assessor fields, ready to hand to a crew for door-by-door verification.site_checklists.xlsx· Printable walking checklists, one sheet per site, 30 in this round. Each sheet opens with a header naming the site address and APN, its address and hanger totals, and the walking-order method, followed by the checklist itself: a done column, the walking order, hanger counts, land use, and distance, with that site's field review parcels listed underneath. A summary sheet totals addresses, hangers, and review parcels per site.match_report.txt· How each of the 30 client sites matched a city parcel record, including which ID field matched, so the link between the client's list and the city's records is auditable.assumptions_log.txt· The run parameters, the headline totals, and the full numbered methodology in plain language.demo_notification_map.html· The interactive map below, a single file the client can open in any browser and share with anyone.
The Interactive Map
Every site is a toggleable layer, so a crew lead can display only the sites scheduled for a given day. Parcels show their address, hanger count, and land use on hover, orange parcels are field review flags, and the search box finds any address in the program, whether a notification parcel, a demolition site, or a field review flag. The map below is the actual deliverable from this engagement, embedded here to explore.
Best explored on a larger screen. Open the map full screen.
Run It Yourself
The engagement was generalized to run on any site list, two ways. The web app takes an uploaded list and returns the full package in the browser. The command-line tool runs the identical pipeline for scripted or repeat work.
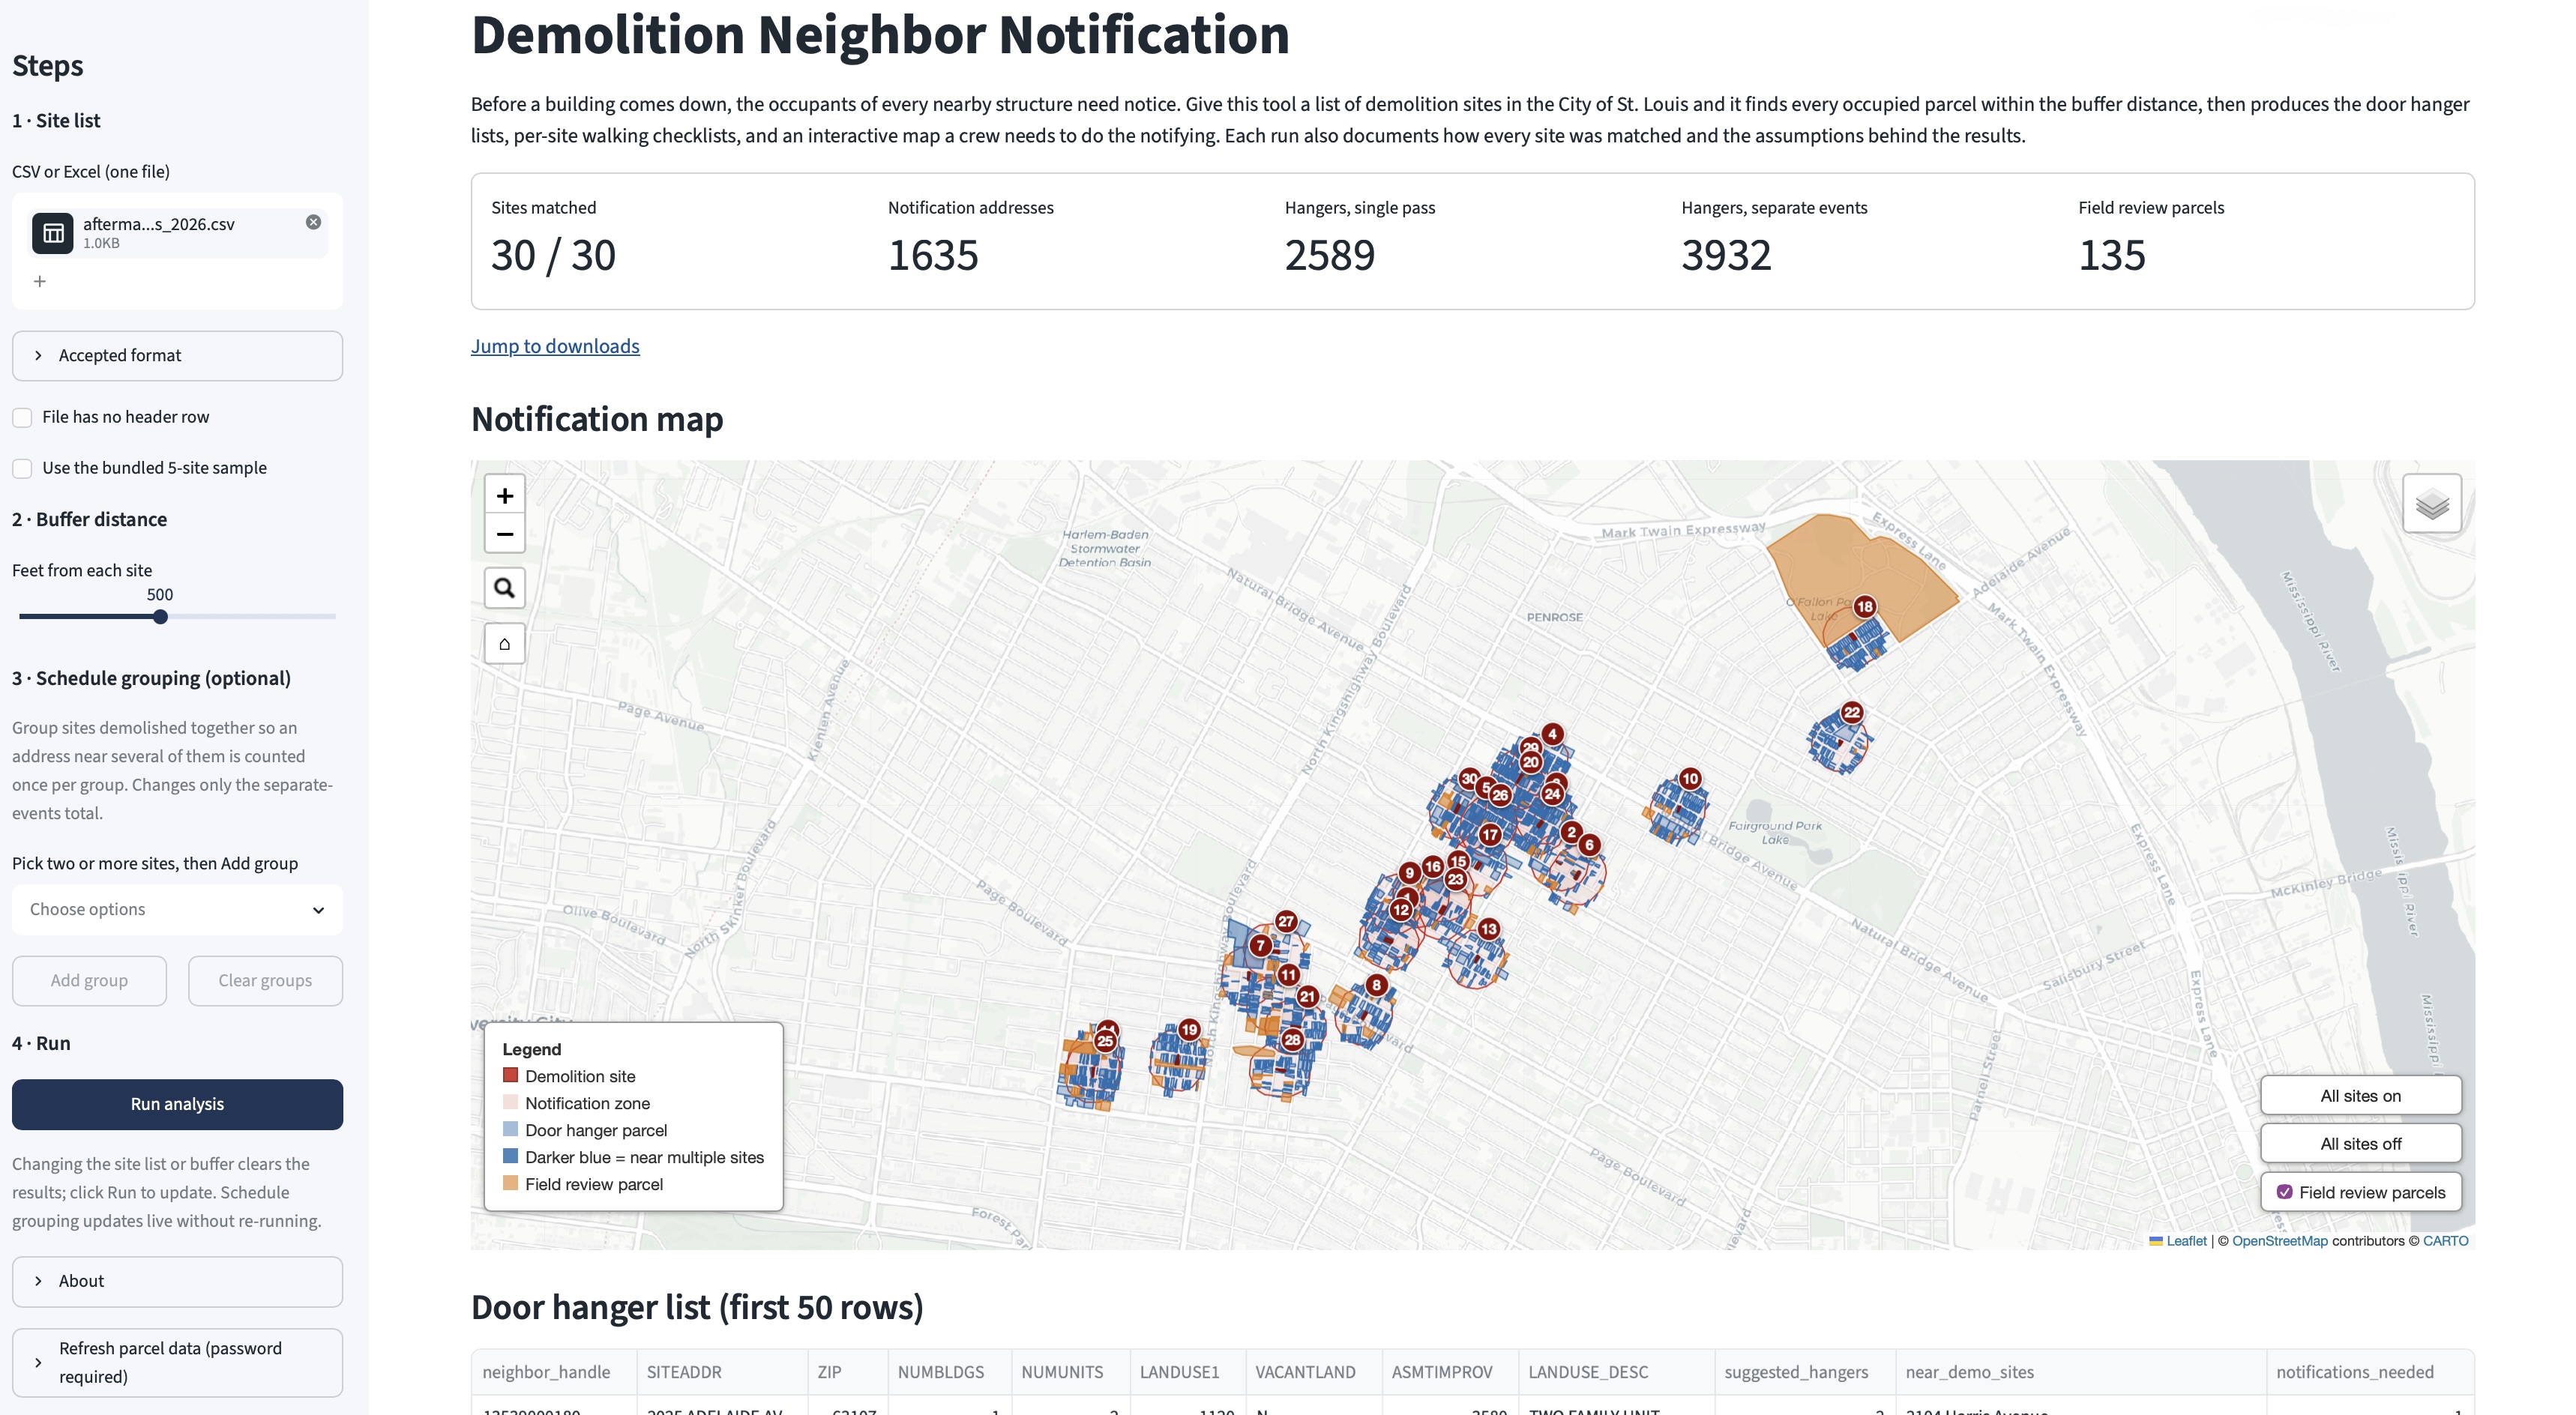
Open the live app in a new tab to upload a site list and download the results. The screenshot reflects a run on current city data, so its totals differ slightly from the delivered figures. The app sleeps when idle and can take a few seconds to wake.
To run it locally, or to script repeat work, install the command-line tool. The parcel cache is committed, so a clone runs immediately.
git clone https://github.com/Erin-Weiss/stl-demo-notify.git
cd stl-demo-notify && pip install -e ".[dev]"
stl-demo-notify run --input your_sites.csv --output-dir output/
Rebuilding the cache from fresh city data is a single command, stl-demo-notify prepare-data --force.
Part 2 · Engineering the Analysis
The original deliverable was a script written under a same-day deadline. This section documents the engineering in the generalized tool, focusing on the design decisions that do not show up in a feature list.
The tool runs as a pipeline. The client's list and the city's data enter on the left, and the finished deliverables come out on the right. Each stage below gets its own section.
Assembling the Parcel Table
The city publishes geometry and attributes as separate downloads. The parcel shapes file carries polygons for 126,958 parcels with almost no descriptive fields. The land records file carries the assessor's attributes, site address, building and unit counts, land use code, vacancy flag, and improvement value, with no geometry. The two are joined on a shared parcel handle to make one working table, and a third download, the city's official Assessor Land Use vocabulary, supplies the text descriptions for the numeric land use codes.
Land use is where the original script guessed. It labeled codes from a hand-built dictionary, with several entries marked as unverified. The tool now downloads the official vocabulary, so code 5811 resolves to the city's own label, FAST FOODS, and a code missing from the table falls back to a labeled placeholder instead of raising an error.
Matching the client's list to this table is where identifiers get difficult. A client site is matched against four of the table's ID columns in priority order, and those columns do not agree on what an ID looks like. ASRPARCEL is text with leading zeros, HANDLE is plain text, PARCEL10 is an integer, and PARCEL is a floating-point number, so parcel 5 is stored as 5.0. The client's own APN arrives from a spreadsheet as yet another type. Comparing a float 5.0 against an integer 5 against the text "5" matches nothing until each is reduced to one canonical form. Every identifier on both sides passes through a single normalizer first:
def norm_id(value: object) -> str:
    if value is None or (isinstance(value, float) and pd.isna(value)):
        return ""
    s = re.sub(r"\.0+$", "", str(value).strip())
    return re.sub(r"[^0-9]", "", s)
It drops a trailing .0, strips any non-digit characters, and returns digits only, so the float 5.0, the integer 5, and a stray "5 " all become "5". Leading zeros are preserved, because they are significant in the ASRPARCEL column. Without this step, equivalent IDs fail to match and parcels drop out of the results with no error raised.
A prepare-data command does the downloading, joining, and normalizing once, caching the result as GeoParquet, a columnar format that stores the geometry and attributes together. The cache loads in about two seconds, and analysis runs never touch the network, so a rerun works identically with no internet connection at all.
The Buffer That Only Looks Like a Circle
The notification zones on the map look like circles, but they are not. Buffering a polygon pushes every edge outward and rounds the corners, producing an inflated version of the parcel's own shape. For one rectangular lot in this file, the 500 foot buffer measured 347.5 by 334.6 meters, visibly close to round but 13 meters off square. The distinction matters because it preserves the client-confirmed rule that distance measures from the parcel boundary. A true circle drawn from the parcel center would be simpler to compute and wrong at the margins.
All distance math runs in EPSG 26996, the Missouri East projected coordinate system, where coordinates are in meters and Euclidean distance is accurate. Latitude and longitude cannot support that arithmetic, because a degree of longitude covers less ground the farther it sits from the equator. Coordinates convert back to latitude and longitude only at the end, for the web map.
Searching 126,958 Parcels in Two Passes
Exact polygon intersection is expensive. Running it between every buffer and every one of 126,958 parcels would give the right answer slowly. The search instead runs in two passes. A spatial index answers a cheap approximate question first, which parcels' bounding boxes overlap this buffer's bounding box, and the expensive exact geometry runs only on that shortlist:
cand_idx = list(sindex.intersection(buf.bounds))
hits = parcels_m.iloc[cand_idx]
hits = hits[hits.intersects(buf)]
The same two-pass shape, a coarse cheap filter feeding a precise expensive one, appears throughout database indexing and retrieval systems. Here it cuts each site's exact-geometry workload from 126,958 candidates to a few dozen, which is the difference between a runtime measured in minutes and one measured in seconds.
The Decision Rules in Code
Each notification decision the client agreed to is a short, explicit piece of code. Because assessor data is inconsistent, arriving as text, blanks, or numbers depending on the column and the year, every field is read defensively rather than trusted.
The structure filter is the rule that a parcel makes the list only when the assessor records at least one building on it. The building count is coerced to a number, with anything unparseable treated as zero:
numbldgs = pd.to_numeric(detail["NUMBLDGS"], errors="coerce").fillna(0)
has_structure = numbldgs > 0
An excluded parcel earns a field review flag when its own record disagrees with the exclusion. That disagreement is one boolean expression:
conflict = (vacant == "N") | (improved > 0)Rather than a generic warning, each flagged parcel gets a reason generated from whichever condition fired, so the field review list tells a crew exactly what to check:
def _review_reason(vacant_value, improved_value):
    reasons = []
    if vacant_value == "N":
        reasons.append("VACANTLAND marked 'N' (not vacant)")
    if improved_value > 0:
        reasons.append(f"ASMTIMPROV recorded at {improved_value:g} (> 0)")
    return "CHECK: " + "; ".join(reasons)
The hanger policy is the rule that every listed address gets at least one hanger, with multi-unit buildings getting one per dwelling unit:
units = pd.to_numeric(numunits, errors="coerce").fillna(0)
suggested = units.clip(lower=1).astype(int)
And the two project totals fall directly out of the deduplicated list. The single-pass total sums hangers across unique addresses. The separate-events total weights each address by the number of separate notification passes near it, one per nearby site, or one per group when sites share a schedule:
total_single_pass = int(dedup["suggested_hangers"].sum())
total_separate_events = int(
    (dedup["suggested_hangers"] * dedup["notifications_needed"]).sum()
)
A declared grouping lowers notifications_needed for addresses near several sites in one group, which lowers the separate-events total without changing the formula.
Each of these rules is also stated in plain language in the assumptions log delivered with the run. The log does not reproduce the code, but it records the buffer rule, the structure filter, the hanger policy, and the rest in sentences a client can read and question, so the reasoning behind every list is written down rather than buried in the program.
The Square Root the Walk Skips
Each checklist orders a site's addresses with a greedy nearest-street walk. Starting at the demolition site, visit the closest street, then the closest remaining street from wherever you now stand, and so on until every street is ranked, with house numbers sorted within each street.
Finding the closest street means comparing straight-line distances between street centroids. The Euclidean distance between two points is:
d = √(x₂ − x₁)² + (y₂ − y₁)²
Only the comparison matters here: which street is nearest, not how many meters away it sits. The square root is a monotonically increasing function, so for any two non-negative numbers a and b, the inequality a < b holds exactly when √a < √b. Ranking the streets by the value inside the root therefore produces the identical order as ranking them by the true distance. The code compares those squared distances and never calls the root at all:
nearest = min(
    remaining,
    key=lambda s: (street_centroid.loc[s, "_x"] - cx) ** 2
    + (street_centroid.loc[s, "_y"] - cy) ** 2,
)
On its own the skipped square root saves almost nothing. It reflects a habit that runs through the tool: work out the quantity the result actually depends on, and compute only that.
The Map's Invisible Engineering
The interactive map is a single self-contained HTML file built with Folium on Leaflet.js, extended with custom JavaScript for the operational controls. Some of its engineering is invisible by design:
- The address search is powered by a fully transparent layer that exists only to be searched, so search covers every notification parcel, demolition site, and field review flag without adding a visible layer to the map.
- A match flies the map to the found parcel and outlines it, rather than dropping a pin that would linger after the next search. The outline clears on the following search, on collapse of the search box, or on return to the home view.
- Parcel geometry is simplified before rendering, trimming vertices the eye cannot see at map scale, which keeps a 1,636-parcel map fast in a browser.
- Address labels mount and unmount based on zoom level, so the zoomed-out view shows numbered site badges and the zoomed-in view shows full addresses.
- Every custom control runs inside the page's load event, because the map object the controls reference does not exist until the generated page finishes loading. Violating that ordering renders a blank map, a constraint discovered by debugging and documented in the code for the next person.
Production Details
A handful of smaller decisions carry the tool from a working analysis to something a business can rely on:
- Reruns cannot destroy delivered work by accident. Client task orders arrive in rounds, so the CLI's run command refuses to write into a directory that already holds output unless replacement is explicitly requested.
- The address fallback is hardened against real addresses. When a site arrives without a usable APN, matching falls back to the address. Street names are regex-escaped and matched on word boundaries, so a search for Oak Avenue cannot silently match Oakland Avenue, and any address that matches multiple parcels logs a warning instead of picking one silently.
- Excel's limits are handled up front. Sheet names are sanitized against Excel's forbidden characters and its 31-character limit before writing, so a long street address cannot crash the checklist writer.
- Input is flexible, with a manual override when it is not. Client files are accepted as CSV or Excel, and parcel-number and address columns are detected by common names, backed by content-based detection that recognizes both parcel-number and address-shaped values when the names are unfamiliar. A file with no header row is handled too, through a checkbox in the web app and automatic detection on the command line. When detection is not enough, command-line flags or the app's column picker name the columns directly. Both interfaces share the same detection logic.
- One malformed row cannot sink a batch. A site whose address will not parse, such as a stray header row read as data, is recorded as unmatched in the match report rather than halting the run.
Validating the Refactor
The generalized tool was validated against the original engagement's delivered files. All four headline figures reproduce exactly: 1,636 addresses, 2,598 and 3,948 hangers, and 134 field review parcels. The remaining row-level differences were investigated individually, and each traced to a deliberate improvement rather than a defect. The official land use vocabulary replaced interpreted labels. The field review reasons became specific instead of generic.
These are the delivered engagement's figures. Because city parcel records change over time, rerunning against a refreshed cache shifts the counts slightly. A refresh to July 2026 data, for example, returns 1,635 addresses in place of 1,636. The committed cache is the permanent copy; a refresh through the app updates only its running container until that container restarts.
One difference took a closer look. A parcel flagged for review can sit near several demolition sites at once, and the field review list files it under a single representative site. The original script chose that site by sorting the parcel IDs as text, an incidental effect of alphabetical ordering. The rebuild makes the choice deliberate, filing each parcel under the first matching site in the client's own list. Both versions flag the same parcels and record the same full set of nearby sites for each; only the single site shown at the head of the row changed.
The test suite runs 44 tests, from identifier normalization and column detection to a grid of synthetic squares where the correct neighbors and distances are computable by hand, so the geometry math is verified against known answers rather than against itself. The tests need no network and no city data, finish in under a second, and run on every push through GitHub Actions alongside ruff linting configured beyond its defaults, adding import-order, bug-pattern, and modern-syntax checks.
Future Work
- Grouped checklists and map. Grouping already recomputes the hanger total for a declared schedule. Extending it to merge those sites' walking checklists and map layers into one combined pass is the remaining step.
- Route optimization. The walking checklists use a nearest-street heuristic. A true routing pass over the street network would shorten crew time further.
- Address-point data. A second city dataset locating individual buildings would refine structure detection on the parcels the assessor's records leave ambiguous.
- A multi-city adapter layer. The analysis is general; the data sources are St. Louis specific. Per-jurisdiction configuration for columns, coordinate systems, and download endpoints would carry the tool to other cities.