Part 2 · ML Engineering

Used Car Price Prediction API

A CatBoost model taken from notebook to production — served via FastAPI with Docker containerization, Kubernetes orchestration, Prometheus observability, and automated CI/CD. The full ML engineering lifecycle.

View Repository → Part 1: Model Development ←
~$1,300
Median prediction error
29
Manufacturers supported
5,600+
Model variants recognized
4
CI/CD pipeline jobs
Motivation

Why this project exists

Used-car pricing is a high-volume, high-stakes problem. Dealerships, online marketplaces, and auto lenders need fast, accurate price estimates to set competitive listings, flag underpriced inventory, and underwrite loans. A model sitting in a notebook doesn't solve any of those problems — it needs an API that's reliable, observable, and deployable.

This project demonstrates the full ML engineering lifecycle: taking a trained model and building the production infrastructure around it. Part 1 found the best model. Part 2 makes it actually useful.

Architecture

Request → Prediction pipeline

Every prediction passes through validation, fuzzy correction, feature engineering, and model inference — the same pipeline used during training to eliminate training-serving skew.

1
Validate
Pydantic v2 checks
18 vehicle attributes
2
Fuzzy Match
"Toyata" corrected
to "toyota" + warning
3
Impute
Optional fields filled
with training medians
4
Engineer
Shared pipeline
transforms features
5
Predict
CatBoost inference
log1p → expm1
6
Respond
JSON with price,
warnings, input echo
Engineering

Key design decisions

Shared Feature Pipeline

The same pipeline.py transforms training data and API inputs. This eliminates training-serving skew — the most common silent failure mode in production ML.

Fuzzy Input Matching

Manufacturer, model, drivetrain, and fuel type are matched against the training vocabulary using SequenceMatcher. Typos get corrected with warnings, not rejections.

Median Imputation

5 optional listing fields are filled with training-set medians when omitted. Users can submit 13 required fields and still get a reasonable prediction.

Prometheus Metrics

Prediction count, latency percentiles, and error rates exposed at /metrics. Middleware-based instrumentation keeps business logic untouched.

API

Example request & response

Submit vehicle attributes via POST and receive a predicted listing price in USD. The API handles typo correction, color normalization, engine parsing, and optional field imputation automatically.

POST /api/v1/predict
{
  "manufacturer": "toyota",
  "model": "camry le",
  "year": 2020,
  "mileage": 35000,
  "engine": "2.5l i4 dohc 16v",
  "transmission": "8 speed automatic",
  "drivetrain": "fwd",
  "fuel_type": "gasoline",
  "exterior_color": "silver metallic",
  "interior_color": "black leather",
  "accidents_or_damage": 0,
  "one_owner": 1,
  "personal_use_only": 1
}
Response · 200 OK
{
  "predicted_price": 27474.00,
  "currency": "USD",
  "model_used": "CatBoost",
  "warnings": [],
  "input_echo": { ... }
}
Production Readiness

What makes this production-grade

Request validation — Pydantic v2 schemas with domain constraints reject malformed inputs with clear error messages
Health probes — Separate /health (liveness) and /ready (readiness) endpoints for Kubernetes probe integration
Autoscaling — HPA scales from 2 to 6 pods based on CPU utilization with scale-down stabilization
Security hardening — Non-root container, dropped Linux capabilities, and read-only access patterns
Zero-downtime deploys — Rolling update strategy with maxUnavailable: 0 ensures no dropped requests
Observability — Prometheus metrics with prediction latency histograms, success/error counters, and K8s scraping annotations
Observability

Grafana monitoring dashboard

The API exposes Prometheus-compatible metrics at /metrics, scraped automatically by Prometheus via Kubernetes annotations. A custom Grafana dashboard visualizes prediction throughput, latency, and errors in real time — the same observability stack used in production ML systems.

Counter
prediction_requests_total
Tracks every prediction, labeled by success or error status for SLA monitoring.
Histogram
prediction_latency_seconds
Captures latency distribution across configurable buckets for percentile analysis (p50, p95, p99).
Counter
prediction_errors_total
Categorizes failures by type — validation errors, server errors, and unexpected exceptions.
Grafana — Used Car Price API Dashboard
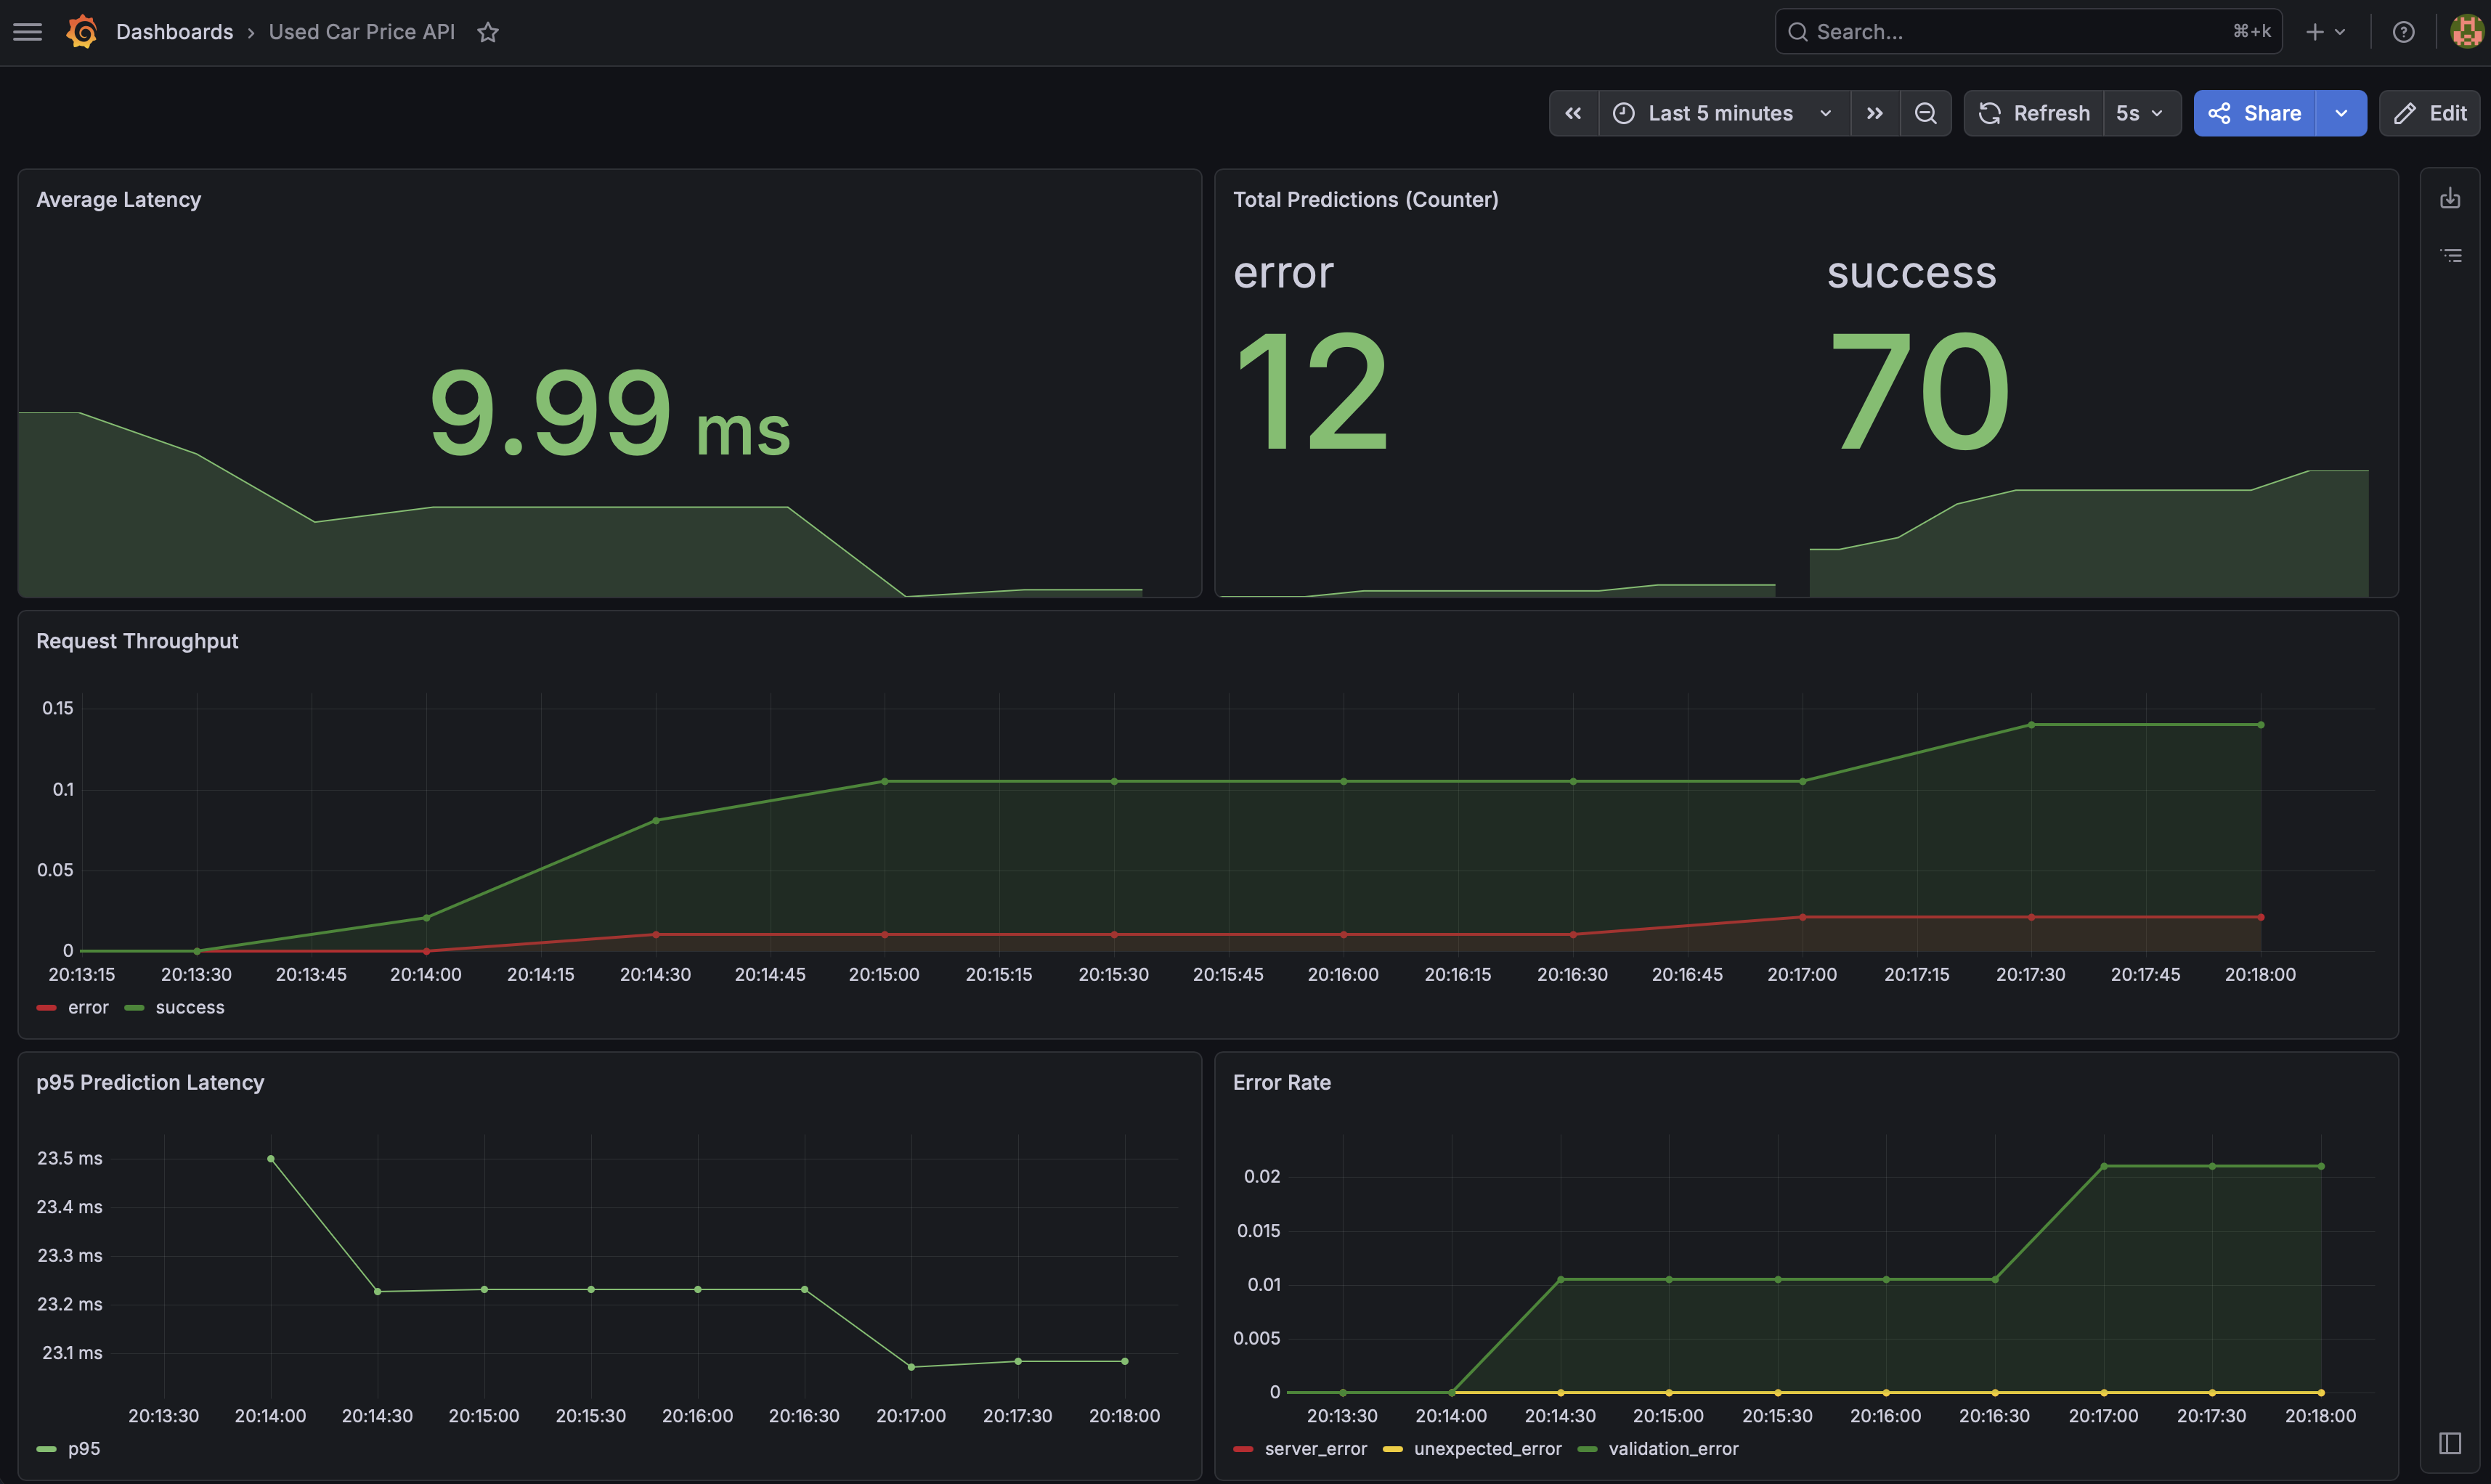
Grafana monitoring dashboard showing average latency (9.99ms), total predictions (12 errors, 70 successes), request throughput over time, p95 prediction latency, and error rate breakdown
Live dashboard running on minikube — 5 panels tracking latency, throughput, error rates, and prediction counts across 2 pods
CI/CD

Automated pipeline

Every push to main triggers a GitHub Actions pipeline with a two-tier test strategy. PRs get fast unit test feedback; merges to main run integration tests against the real CatBoost model.

🧪
Unit Tests
Mocked model fixtures
🐳
Docker Build
Real model via LFS
☸️
K8s Validation
kubeconform lint
🔬
Integration
Real model predictions
Stack

Technologies used

Python FastAPI CatBoost Pydantic v2 Docker Kubernetes Prometheus Grafana GitHub Actions pytest pandas NumPy Uvicorn
Explore

Project links